ReactIR
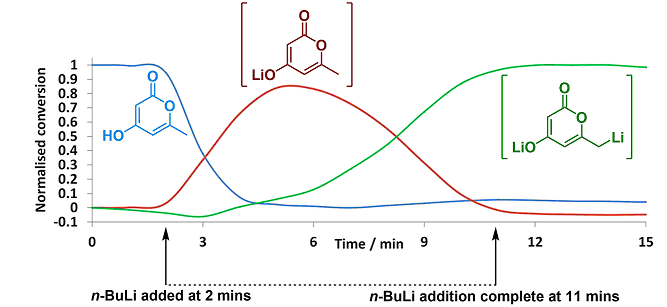
Employing in situ infra-red spectroscopic measurements for chemical processes is a well-established method for characterising and quantifying starting materials, intermediates and products in real-time. We have two ReactIR systems (IC10, RIR15) with silicon and diamond probes, which allow us to examine a wide range of reactions from inert solvents through to aqueous systems.
TR-IR
Time-resolved (pump-probe) infrared spectroscopy is a powerful technique to understand and monitor the ID of short lived reaction and catalytic intermediate species. It is used to observe each step in detail, from catalyst activation, through a number of intermediate species, and finally chemical formations. This is done in collaboration with CLF ULTRA at Harwell campus in Oxfordshire.

LIFDI-MS
Liquid Injection Field Desorption Ionisation is a valuable method for characterising organometallic complexes. It can be used to characterise air sensitive complexes particularly. We also find that LIFDI-MS is the method of choice when all other methods fail, e.g. ESI-MS.
XANES and EXAFS
From time to time we visit the Synchroton to employ XANES and EXAFS techniques to enable characterisation of metal nanoparticles in catalytic cross-coupling chemistry, under working reaction conditions. We collaborate with Prof. Adam Lee (Aston University) who is an expert surface scientist and physical chemist working in the area of catalysis and sustainability.

Complex NMR Spectroscopy
From time to time more complex NMR spectra are obtained for some of the metal complexes that we prepare. An example is the binuclear palladium(0) complex containing the FLEXIphosO ligand:
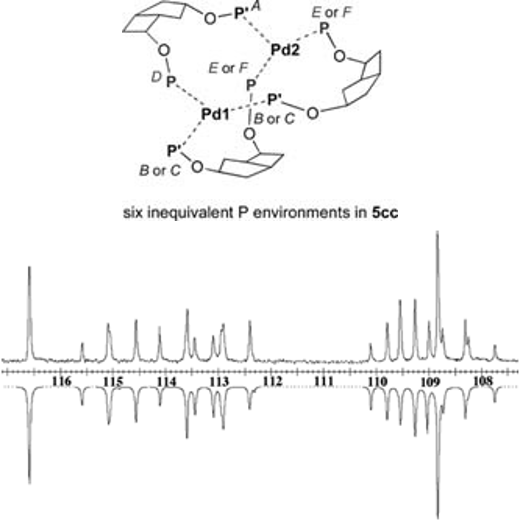
Experimental (upper) and simulated (lower) 31P NMR spectra for Pd02(FLEXIphosO)3 (mixture of isomers).
| P Environment | δ | JA | JB | JC | JD | JE |
| A | 109.3 | – | – | – | – | – |
| B | 109.5 | 0 | – | – | – | – |
| C | 108.4 | 0 | 116.0 | – | – | – |
| D | 113.6 | 0 | 123.7 | 126.8 | – | – |
| E | 112.9 | 107.8 | 0 | 0 | 0 | – |
| F | 115.0 | 108.7 | 0 | 0 | 0 | 100.4 |
